
by Paolo Scala and Miguel Mujica (Amsterdam University of Applied Sciences) and Daniel Delahaye (Ecole Nationale de l'Aviation Civile)
As presented at the 2017 Winter Simulation Conference
Abstract
This paper deals with the improvement of the robustness of heuristic solutions for aviation systems affected by uncertainty when the resolution of conflicts is implemented. A framework that includes the use of optimization and simulation is described which in turn generates pseudo-optimal schedules. The initial solution is progressively improved by iteratively evaluating the uncertainty in the generated solutions and calibrating in accordance with the objective function. Simulation is used for testing the feasibility of a solution generated by an optimization algorithm in an environment characterized by uncertainty. The results show that the methodology is able to improve solutions for the scenarios with uncertainty, thus making them excellent candidates for being implemented in real environments.
Introduction
Airport Systems are considered as critical infrastructures that promote connectivity, value to the region and key for fostering the global interaction of different countries, industries and people. For that reason the expected growth is a threat for the current facilities and it should not be desirable to limit the growth by the technical limitations of the facilities. Furthermore, the airport is a connection of elements and processes that require proper tools for efficiently manage them. Airport operations can be distinguished in landside operations and airside operations, where landside operations are the ones that occur inside the terminals, and airside operations are the ones that occur outside the terminal. Regarding landside operations, it is possible to identify the passengers as entities and check-in desks, gates, or even recreational places like shops and cafe as resources. Regarding airside operations, aircraft can be identified as entities, and ground handling, runways, taxiways, airspace sectors, just to cite some of them, as resources. So from this classification it can be noticed that, in the airport system, two subsystems are identified, very different from each other and governed by completely different dynamics and logic. Moreover, these two different subsystems interact with each other and affect each other performance. So, the characteristics of an airport system, as previously described, are in line with the definition of complex systems given at the beginning of this section and therefore, airport systems should be considered as complex systems when they are analyzed. Another element that characterize aviation systems is the stochasticity, aviation systems are by nature stochastic and for that reason simulation is a key technique for getting the proper required insight in order to increase predictability. Furthermore, aviation is highly dependent on schedules, this also makes their problems prone to be improved by the use of optimization techniques. However, practitioners have recognized that optimization techniques alone fall short when they are used for solving capacity problems (Scala, Mujica, and Delahaye 2016). In this context a fundamental concept that needs to be considered is the robustness of solution coming from optimization models. Due to the variability of the system, a solution provided by an optimization model can cover several scenarios with uncertainty, so a solution is defined robust if it can be applied to more uncertain scenarios without major changes in performance.
In the literature there are many works that are related to the robustness of solution for aviation problems, the outcome of these works is the development of many tools and methodologies. Chandran and Balakrishnan (2007) proposed a dynamic programming algorithm for robust runway scheduling. In their work they considered uncertainties in the aircraft arrival times, coming up with a trade-off between runway throughput and probability of violating separation minimum on the runway as objective. Kim and Feron (2011) tackled the robust gate assignment problem when stochastic delays are introduced. They defined robustness as the interval time between two aircraft that park at the same gate, so the bigger is the interval the more robust is the solution. They computed the number and level of disturbed assignments and they solved the problem using a linear mixed 0-1 optimization model and the tabu search meta heuristic showing improvement, when compared to the original schedule, in the number and level of disturbed assignments of the 92% and 95%, respectively. In the work of Arias, Guimarans, Mujica, and Boosten (2013) the stochastic aircraft recovery problem is solved by employing constraint programming paradigm in combination with simulation techniques, the robustness of the solutions is assessed comparing the standard deviation obtained from simulated results with the variation of the probabilistic distribution used for generating stochastic delays, and its expected propagation due to the problem size. In the PhD thesis of Lee (2014) airport surface congestion problem was tackled, in his work he employed optimization for scheduling runways and taxiways operations and then stochastic simulation to deal with uncertainties. Narciso and Piera (2015) considered the robust gate assignment problem proposing a causal model employing coloured Petri nets (CPN) formalism obtaining the minimum number of gates necessary to absorb the traffic.
The focus of this paper is the improvement of robustness, as it was defined previously, for solutions coming from optimization models solved by meta heuristics. The methodology is iterative, and it aims at finding solutions which fit best in a system affected by uncertainties. In this paper it is presented an application of this methodology to the airport conflict detection and resolution problem. Results confirm that after two iterations, by changing parameters of the algorithm implemented for solving this problem, it is possible to get an improvement in the initial solution. The paper is organized as follows, in section 2 the problem tackled in this paper is described, then in section 3 the methodology is presented together with the description of the optimization and the simulation model. Section 4 shows the implementation of the methodology applied to the airport conflict detection and resolution problem and in the same section results are shown and discussed. In the final section, conclusions and future work is presented.
Problem Description
Nowadays, many European airports are on the edge of their capacity limitations and this can be attributed to the fast growing of the air traffic in the recent years. Moreover, a growth in the air traffic has been forecasted (Airbus 2016) for the upcoming years, therefore, in a future scenario of potential congestion, solutions need to be given to overcome this issue. Airport congestion is identified especially inside the airspace terminal manoeuvring area (TMA) and on the ground in the proximity of the runway entry. The TMA is a portion of the airspace that surrounds airports, here the flow of landing aircraft converge to the airport airside. A good management of arrivals and departures rate made by the air traffic controllers can relieve the airport, airspace and ground side, from potential congestion situations and at the same time increase the runway throughput (Frankovich 2012). The airport conflict detection and resolution problem, which has been considered in this paper, refers to the sequencing of the aircraft landing flow and ground capacity management. In this specific problem, conflicts are detected in the airspace due to separation minima restrictions, and on the ground due to capacity overloads. In the next sections conflicts for airspace, runways and ground components are described in more detail. The objective of solving this problem is to ensure safety for the aircraft flow in the airspace reducing the airspace conflicts to zero and reduce capacity overloads on the ground. For further and more detailed information about this problem please refer to Ma, Delahaye, and Sbihi (2016).
Airspace and Runway Conflicts
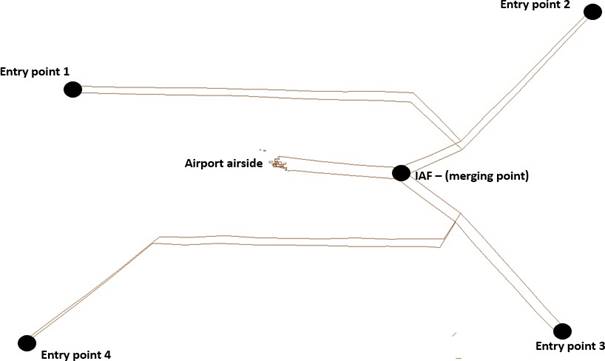
Concerning the airspace, given some landing routes merging at one final point (initial approach fix-IAF) (see Figure 1), and a set of landing aircraft, the main objective is to make the sequence of the aircraft so they will merge at the IAF without incurring in separation minima infringements. Regarding the runways, conflicts are detected when the separation between two consecutive aircraft that are crossing the runway is less than the required separation minima. Separation minima values are set according to the different runway operations, which can be arrivals (runway in) or departures (runway out), and they are based on the wake turbulence category of the leading and the trailing aircraft. Separation minima for the airspace are provided by ICAO standards (ICAO 2007) and separation minima for the runway are taken from Frankovich (2012).
Ground Conflicts
Concerning ground operations, the developed model is a high-level one, meaning that ground operations are not modeled in detail. So first the main components of the ground are identified and then a capacity is attributed to each of them. The main ground components identified are taxiways and terminals. Capacity is defined as number of aircraft that are simultaneously using one of the components. Once the aircraft have landed and exited the runway, they cross the taxiway until they park at the gate. As mentioned before the model of the ground is a high-level one, which means that taxiway routes were not considered in detail, therefore, taxiway operations were modeled using average travel time. Turnaround times were based on a real schedule, and the travel time on the taxiway from the gate until the departing runway entry was considered using average travel time. The objective is to do not exceed the capacity of these components, conflicts in this case are represented by the sum of maximum capacity overload and the average capacity overload. Table 1 shows the capacity of the main ground components related to the example considered in this work.
Table 1: Capacity for the main ground component.
Ground component |
Capacity |
Taxiway network |
18 |
Terminal 1 |
11 |
Terminal 2 |
91 |
Terminal 3 |
57 |
Framework
The framework which will be introduced in this section will be the combination of a sliding window-based optimization model together with a discrete event simulation based model to achieve the aforementioned scope. In the rest of this section the structure of the methodology will be introduced and then both the optimization process and the simulation environment will be described in more detail.
Methodology Description
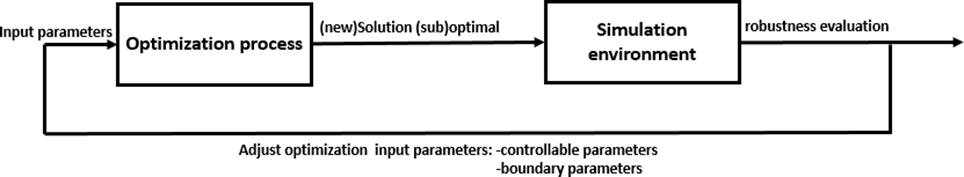
The methodology proposed in this paper, can be represented by two main steps as depicted in Figure 2. In the first step, the system under study is subject to an optimization process with the aim of getting optimal or suboptimal solutions according to a specific objective. In this paper, this methodology is applied to the airport conflict detection and resolution problem, where the objective of the study is to achieve a scenario with zero conflicts. Bearing in mind that the optimization process leads to an exact solution, where most of the operational parameters are deterministic, it is likely that this solution, when tested in a real environment, will be sensitive to slight changes due to system variability. In the second step of the methodology, simulation is employed to introduce the variability of the system and to test the robustness of the solution provided by the optimization process. In the simulation environment, some relevant parameters that affect the solution in reality, are allowed to have uncertain values. This methodology is iterative, which means that these two steps will be applied as long as the robustness will be improved according to a certain level of satisfaction, which represents the stopping condition of the iterative process. In this work robustness is measured as the deviation in the performance of the simulated solution from the ideal scenario, where the performance is evaluated as number of conflicts and the ideal scenario is a solution that gives zero conflicts. In this context, the robustness is improved when this deviation is minimized.
Optimization Process
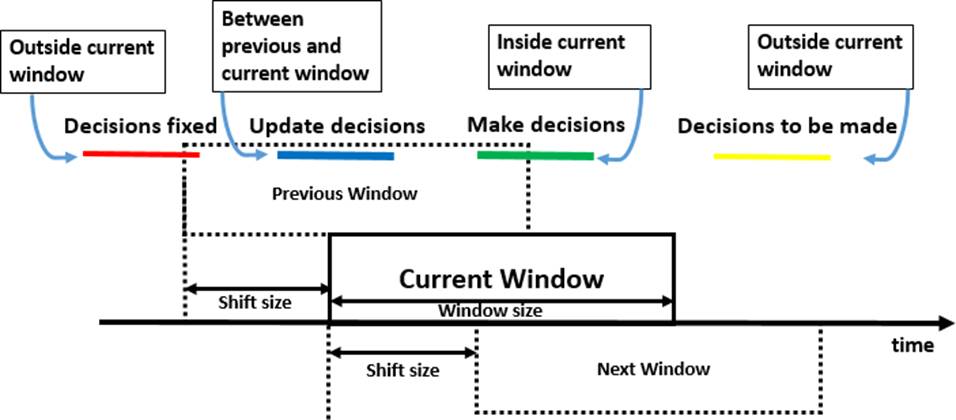
The optimization process that has been applied in this methodology, and specifically for the airport conflict detection and resolution problem, is based on a sliding window approach. This approach divides the entire problem in smaller subproblems according to a window size, and then shifts the window along the time horizon. The main advantages of this method are that the subproblems are easier to solve and require less computational time, moreover, it tackles the problem in a dynamical fashion by updating the decision variables while the window slides along the time horizon, resulting in an improvement of the quality of the solution. This approach has already been employed in similar problems giving good results (Hu and Chen 2005, Zhan, Zhang, Li, Liu, Kwok, Ip, and Kaynak 2010, Furini, Kidd, Persiani, and Toth 2015, Toratani, Ueno, and Higuchi 2015, Man, Delahaye, and Xiao-hao 2015, Ma, Delahaye, Sbihi, and Mongeau 2016). In this approach, each entity (aircraft) is associated with a certain status according to its position relatively to the current window. As a result, the status of an entity can be complete if it is outside the current window; on-going if the entity is between previous and current window; active if the entity is inside the current window; planned if the entity is in the next window. In the current window, decisions will be made only for the entities with on-going and active status, while for the completed entities they have already been made. Concerning the planned entities, the decisions will be made in the next window (see Figure 3).
The main parameters of the sliding window approach are the window size and the shift size, they affect the performance of the optimization process in terms of computational time and quality of the solution, so it is crucial to set these two parameters with proper values in order to get good solutions. A small window will lead to solve small subproblems but some flight info might not be considered. A big window will lead to solve bigger problems but at the same time some flight info might be considered too early. In both cases the effectiveness of the solution is affected. A small shift will lead to update many decision variables at every window shift, a big shift will lead to fix more decision variables and update less decision variables at every window shift affecting the performance of the algorithm.
The solution space of this problem is considered NP-Hard (Beasley, Krishnamoorthy, Sharaiha, and Abramson 2000), which justifies the use of a meta heuristic in order to solve the problem and to obtain a (sub)optimal solution. To that purpose, each subproblem, defined by the sliding window approach, has been solved by means of the simulated annealing meta heuristic (Kirkpatrick, Gelatt, and Vecchi 1983). This meta heuristic has been proven to be very efficient when dealing with similar problems (Man, Delahaye, and Xiao-hao 2015, Ma, Delahaye, Sbihi, and Mongeau 2016). The definitions and detailed explanations of the sliding window approach and of the meta heuristic are out of the scope of this paper, for more detailed information and a better understanding of this optimization process applied to this specific type of problem please refer to Ma, Delahaye, and Sbihi (2016).
Simulation Environment
Discrete event simulation (DES) has been put in the loop for evaluating the effect of uncertainty in the solutions proposed by the optimization algorithm, in this section, the advantages of the use of simulation for this purpose are described. The use of DES allows to include the uncertainty in the scenarios which is not possible or highly complicated using other techniques. In this context, the introduction of uncertainty with simulation makes the situation closer to reality and with the definition of robustness it is possible to achieve a solution that might be not mathematically optimal but more resilient to disruption in the real system. DES has been widely used in many fields, from manufacturing to transportation, already since the last decades, and it has been proven to be useful for what-if analysis, scenario testing, and as a decision support tool (Banks 1998, Brunner, Cross, McGhee, Levis, and Whitney 1998, Negahban and Smith 2014). In DES, time passes according to the occurrence of specific events and the sequence of actions that the entities make are already known in advance. The use of this modelling approach is better than other ones like agent-based or system dynamics due to the fact that the processes modelled follow sequential processes which can be properly modelled under this paradigm. The use of other ones like agent-based for instance is more suited for situations in which the modeled entities have more degrees of freedom and it is necessary to implement the logic behind the decision-makinig process that the entities undergo. In the system modelled in this work, this is not required, thus giving us a framework more flexible, easy to maintain and faster than the one that can be achieved with a different technique.
Implementation
The methodology presented in section 3.1 has been applied to the airport conflict detection and resolution problem. In the next sections the main parameters of the simulation and optimization model and two iterations of methodology implemented with the relative results are presented.
Parameters of the Methodology
The parameters involved in this methodology can be classified in three groups: controllable parameters, boundary parameters and stochastic parameters. The first ones refers to parameters that are related to the problem under study and therefore are problem specific. Boundary parameters are related to the optimization process itself, so they depend on the type of optimization that has been used. Controllable parameters are part of the optimization model, as they represent the decision variables of the problem. Stochastic parameters represent the sources of stochasticity of the system so they depend on the system under study. In the following sections these parameters are presented and discussed. The controllable and the boundary parameters are very important because they are the drivers of the methodology implementation. Each iteration of the methodology is based on a different setting of these parameters. Stochastic parameters are implemented by the simulation model resulting key factors for the goodness of the methodology. It is important to choose and calibrate them properly, in this work it has been made an initial estimation for them.
Controllable and Boundary Parameters
Controllable parameters of the airport conflict detection and resolution problem considered in this work are:
- Entry speed in the airspace: increase or decrease the speed of the aircraft entering in the airspace for the final approach.
- Entry time in the airspace: delay or advance aircraft entering in the airspace for the final approach.
- Pushback time: delay aircraft at their gates before they leave for departing.
Boundary parameters refer to the sliding window parameters:
- Window size: define the size for each subproblem solved by the algorithm.
- Shift size: define the size of the shift for the window and therefore the amount of decision variables that are updated for each subproblem.
In Table 2 controllable and boundary parameters are summarized with their respective values used for the initial optimized solution. Note that values of the parameters entry time in the airspace and pushback time are discretized according to 5 second interval, while entry speed in the airspace is discretized according to 1 percent interval. Optimization parameters are continuous.
Stochastic Parameters
Stochastic parameters of the airport conflict detection and resolution problem considered in this work are:
Table 2: Controllable and boundary parameters.
Entry speed in the airspace |
[-10% , 10%] |
Entry time in the airspace |
[-5 min. , 30 min.] |
Pushback time |
[0 , 15 min.] |
Window size |
3 hrs. |
Shift size |
30 min. |
In Table 3 stochastic parameters are summarized with their respective values used in the simulation model. Note that stochastic parameters are continuous.
Table 3: Stochastic parameters.
Entry time in the airspace deviation |
[-30 sec. , +30 sec.] |
Taxiway time deviation |
[-10% , +10%] |
Pushback time deviation |
[-60 sec. , +60 sec.] |
Experiments
The methodology proposed in this paper has been applied to the airport conflict detection and resolution problem, two iterations of the methodology are presented in this work. At the beginning a solution that represents the original schedule is given, then another solution, this time implementing the optimization process, is presented and the two solutions are compared to each other. After an optimized solution is found by the optimization algorithm, uncertainty is introduced with the simulation model, where 50 replications for each run were completed. The outcome from the simulation is then analyzed in order to test the robustness of the optimized solution. In the same way a second iteration was conducted by running the optimization model by changing some of the methodology parameters presented in 4.1.1, and then testing the new generated solution with the simulation model. The original schedule is based on one day real traffic data (7 February 2016), at Paris Charles de Gaulle airport, as both the optimization and simulation model have modelled the operations of this specific airport. In the following charts results from the initial schedule are illustrated, showing many conflicts for airspace, runways and a big capacity overload for taxiway network and terminals.
Regarding airspace and runway conflicts, they have been calculated on a hourly base, in this way it is possible to see in which part of the day they are concentrated. Figure 4(a) shows that the peak hours conflicts in the airspace happen around 8, 9, 12, 13 and 20 o’clock, ranging between 80 and 90 conflicts. Regarding conflicts on the runways (in and out), figures 4(b) and 4(c) show that there are many conflicts for them. In the runway in conflict trend there are peaks between 8 and 10 o’clock and also at 20 o’clock, in the runway out conflict trend there are peaks between 11 and 12 o’clock and also at 14 o’clock.
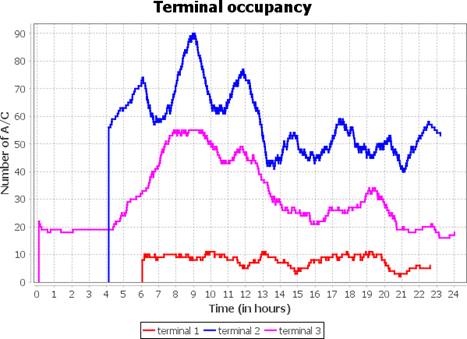
Regarding taxi out conflicts, in Figure 5(a) it can be seen that there is an overload in the capacity, which is set as 18, from 9 to 14 o’clock and from 19 to 21 o’clock, with a maximum peak of 25 around 21 o’clock. Figure 5(b) shows the occupancy for the three terminal considered, where especially for the terminal 1 (capacity 11) there is a constant overload from 6 to 21 o’clock.
First Iteration
According to the methodology procedure, in the first step of each iteration the optimization model is run and an optimized solution is obtained from it. In this case after running the optimization model a scenario with zero conflicts has been found for both airspace and ground components. Figures 6(a) and 6(b) show


the occupancy trend during the day for the taxiway network and terminals, where it can be noticed that there are not capacity overload.
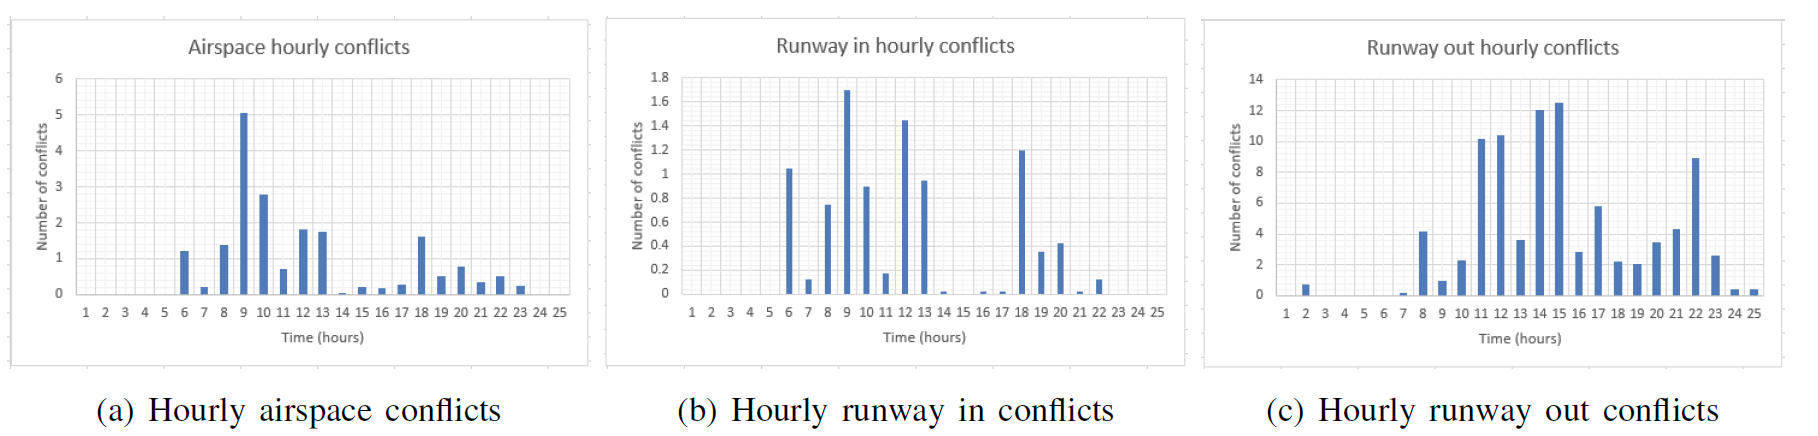
The first iteration is completed running the optimized solution in the simulation model, in figure 7 hourly conflicts trends for airspace and runways are illustrated.
When uncertainty is included it can be seen that, despite the optimization solution gives a scenario without conflicts, new conflicts appear. Specifically for the airspace, there is a peak of 5 average hourly conflicts at 9 o’clock, and some other conflicts spread during the day (see figure 7(a)). Regarding the runway in, it can be seen that it is not much affected by the uncertainty since the average hourly conflict peak is almost 2 (see figure 7(b)). The runway out, instead, is more affected by the uncertainty, in this case there are many average hourly conflict peaks during the day, 10 between 11 and 12 o’clock, 12 between 14 and 15 o’clock and 9 at 22 o’clock (see figure 7(c)). Regarding ground component overload, terminals were not affected by the uncertainty since there were not capacity overload for them, taxiway average maximum capacity overload was 2.05.
Second Iteration
A second iteration is conducted since results from the first iteration showed the presence of conflicts after the inclusion of uncertainty. In this second iteration the optimization model has been run adjusting some of the controllable or boundary parameters so to have a new solution to be tested with the simulation model. In this case, running the optimization model, a new solution has been obtained by changing the window size of the sliding window optimization approach from a window of 3 hours to a window of 2 hours. This choice was justified by the fact that often when the window size is too long, the algorithm considers too early the info of some flights that are far ahead in the schedule, and this can lead to a loss of the dynamical

advantage of the approach affecting the quality of the solution. So testing a smaller window size might lead to a more robust solution. The results of the new solution are shown in Table 4.
Table 4: Results from the optimization, second iteration.
Airspace conflicts |
0 |
Runway (in and out) conflicts |
1 |
Taxiway network (maximum overload + average overload) |
0 |
Terminal 1 (maximum overload + average overload) |
1.04 |
Terminal 2 (maximum overload + average overload) |
0 |
Terminal 3 (maximum overload + average overload) |
1.04 |
As can be noticed, this solution provides an almost conflict free scenario, since some conflicts appear for the runways, and for the terminals. So from the optimization point of view this solution is not optimal but suboptimal. In figures 8(a), 8(b) and 8(c) are illustrated the results obtained after testing this solution by means of the simulation model. In figure 8(a) it can be seen that three peaks of 4, 5 and 7 airspace average hourly conflicts are found at 6, 10 and 12 o’clock respectively. Regarding the runway in average hourly conflicts, as it can be seen from figure 8(b), there are two peaks of 1.6 and 2.1 at 8 and 12 o’clock respectively. Results for runway out records only one peak of 14 average hourly conflicts at 14 o’clock.
In table 5 are summarized the results from the two iterations. Looking at the second and the third column, relative to the first and second iteration, it can be noticed that the second iteration improves average runway out conflicts from 89.9 to 85.32, while does not improve average airspace conflicts. The values of other components, runway in, taxiway and terminals are stable between first and second iteration.
The expected result of the methodology should be the progressive decrease in the number conflicts after each iteration and, at the same time, obtaining a solution where the conflicts are balanced between all

Table 5: Comparison between the results from the two iterations.
|
First iteration |
Second iteration |
Avg airspace conflicts |
19.60 |
26.77 |
Avg runway in conflicts |
9.30 |
9.50 |
Avg runway out conflicts |
89.90 |
85.32 |
Avg taxiway overload |
2.05 |
2.06 |
Avg terminals overload |
0 |
0 |
the components. In this case after two iterations it can be seen that some improvements have been reached for some parts of the systems, especially for the runway out, while for the airspace, the methodology was not able to make improvements. Concerning the ground components, the results confirmed that they were not much affected by variability meaning that they could be well predicted. However, the interpretation of the outcome after two iterations, when the overall airport system performance is considered, points out that the solution of the second iteration is more balanced than the solution of the first iteration, which is an improvement in terms of robustness. Implementing further iterations of this methodology, it is expected to obtain even more improvements in the robustness of the solutions.
Conculusion and Further Steps
In this paper a framework for the improvement of the robustness of optimized solutions applied to the airport conflict detection and resolution problem was presented. The results demonstrate the feasibility of the concept of combining the two methodologies for providing more robust solutions. Uncertainty confirmed to be of high nuisance when applied to an optimized solution. Airspace and runway conflicts were affected the most after including variability in the system, while ground components were less sensitive to it. The methodology, iteratively implemented, was able to lower the conflicts for the runway out, however, it was not very effective for the conflicts in the airspace. In general after two iterations the methodology achieved a more balanced solution. The further discussion would be on how to implement a cyclic approach so that we are able to fine-tune the robustness of the solution obtained by the combination of the two approaches. Further studies can be conducted towards the choice of the parameters to adjust at each iteration in order to make it more effective and efficient. Another aspect that can be studied as a future development of the methodology is the choice of the values for the stochastic parameters that can be done, for example, by processing historical data.
ACKNOWLEDGMENTS
The authors would like to thank the Aviation Academy of the Amsterdam University of Applied Sciences and the Dutch Benelux Simulation Society and EUROSIM for disseminating the results of this work.