by Joseph K. Agor (North Carolina State University)
As presented at the 2016 Winter Simulation Conference
Abstract
This extended abstract provides an overview of the development of a simulation model to be used in the assistance of triaging patients into the Hospital Internal Medicine (HIM) Department at The Mayo Clinic in Rochester, MN in an effort to balance workload among the department services. The main contribution of this work is the development of a score that measures provider workload more accurately. Delphi surveys, conjoint analysis, and optimization methods were used in the creation of this score and it is believed to better represent provider workload. Preliminary results were based on the proportion of time of a month that each service was at or above “maximum utilization”, which is how workload is currently viewed at an instance. A simulation model built in SIMIO 8 yielded a 12.1% decrease in the proportion of time that a service was at or above their “max utilization” on average, while also seeing a decrease in the average difference among these proportions by 8.3% (better balance among all services).
Introduction
Since 1990, the healthcare literature has seen a substantial increase in publications regarding the workload experienced by healthcare professionals. The concept of workload is a topic of interest because of its implications in healthcare settings. For example, research has shown that the amount of workload placed on nurses directly affects patient outcomes, as well as nurse satisfaction and resilience in the workplace. In order to prevent negative consequences of high workload, methods must be created to manage and balance workload among healthcare providers. The project aim is to develop a score that more accurately represents the “perceived workload” among providers operating in 13 hospital services within the HIM department at The Mayo Clinic located in Rochester, MN and verify the scores validity through simulation. Other objectives of the project is to provide the HIM department with a simulation based tool that will allow providers and administration to run “what-if-scenarios” and to test any policies stemming from the created score (in progress). While the score does need to be adjusted based on suggestions from providers and administrators, preliminary results generated through the simulation indicates that the use of our score will lead to a more balanced workload among the hospital services (see Figure 2 below).
Development of the Simulation Model and Score
Currently, the census (number of patients in the service) is the only tool that is used by the Medical Officer of the Day (MOD) to triage patients into the hospital and this does not accurately reflect the workload that the providers of those services is experiencing both objectively and subjectively. Through the use of two Delphi surveys (one conducted prior to the arrival at Mayo Clinic and one conducted while on site) and conjoint analysis on the second survey, we were able to capture what factors (xi) contribute to the providers perceived workload. Then a linear optimization model was built to come up with weights (wi) for these factors with an objective to minimize the deviation from the provider input. The developed score was the linear combination of these weights and factors (Score = ∑ 𝑤𝑖𝑥𝑖 ). Next, a full simulation was built to replicate the process of how a patient progresses through the HIM department to validate the proposed score. Figure 1 below gives the high level visual of the simulation:
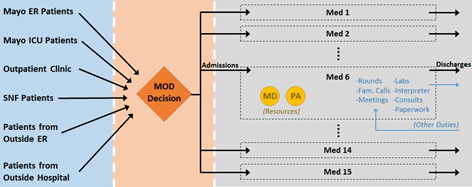
We simulated patients moving through all 13 medical services in the HIM department (Resident Services 1-4, Medical Services 5-9, 11, & 14, and Gastro and Pulmonary Services). Within each of the services themselves, sub-models were built where the providers are modeled as workers that can be seized by jobs created by patients within their service. Each day, the simulation decides if a patient will stay in service based on their historical discharge time and if so, jobs are created at the start of each day that the providers will need to take time to do (i.e. rounds, family visits, paperwork, etc). Similar admittance work is created for the providers when a patient is first admitted to their service (i.e. assigned to their service by the MOD). Using the historical data, we were able to implement a policy based on the lowest workload score and compared the results to the reality of what actually happened.
Results and Conclusions
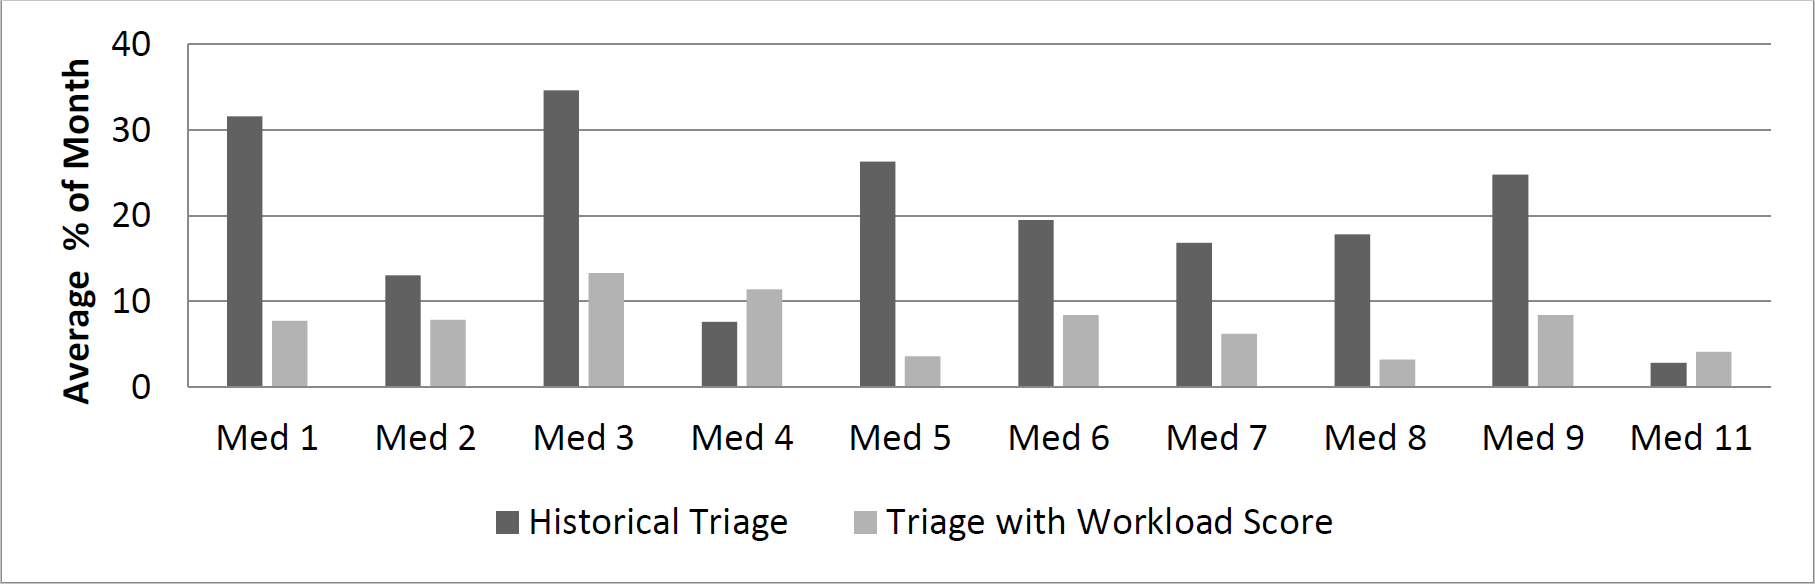
Figure 2 below shows the average proportion of the month each service was at or above “max utilization” as currently defined by providers in the department. Historically, we see a significant imbalance with respect to the time that each service spends in max utilization. However, through a crude implementation of triaging to a service with the lowest workload score, we see a significantly better balance with respect to the distribution of time that each service spends in max utilization. We also see that overall, the proportion of time that each service spends in max utilization is decreased, implying less workload among providers, which will most likely lead to overall better healthcare service provided to patients. The Mayo Clinic provided us a case study for triaging patients in a hospitalist scenario, but this simulation and score can be generalized for other departments and facilities that have a similar process.