Search the Community
Showing results for 'Rate table'.
-
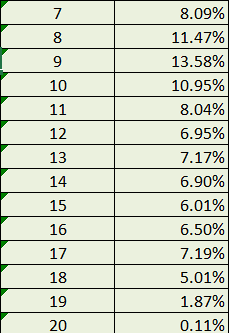
First of all, Thank you so much for the answer in advance, but could I bother anyone who answers with some example model or picture of the method I am still new to SIMIO, so I am concerned about following the advice correctly. 1) Let's say every day I have X number of people arriving( using distribution to generate numbers outside SIMIO randomly). This is the shop where people visit from 8.00 to 20.00 every day with different visit rates per hour (example as below), and I use X to time to this percentage so I can get the exact number of visits per hour. The problem is I want to make an arrival interval random with some sort of function/distribution or table(excel calculation), not a stable arrival rate. My idea is random from 0 to 1 and gives the random number (Y) to match with X outside SIMIO and put the whole table in, but I wonder, is there any better method than this? 2) The second question is about two entities from different sources, A and B. A and B will go through the same server for three servers, but after server 3, one will go to 4, and one will go to 5. Can you give me any advice on how to do that
-
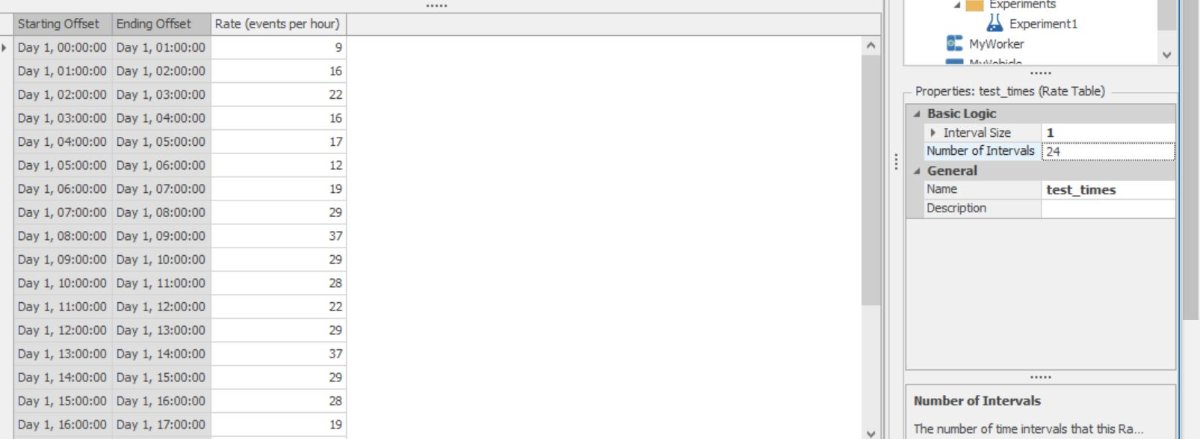
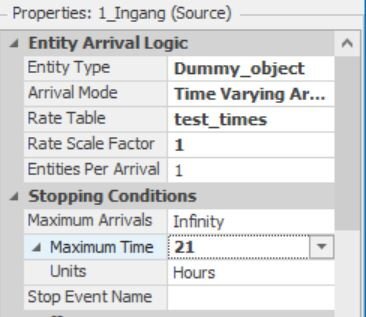
hey Simio insiders, I am experiencing a problem using rate tables. I want to utilize rate tables to generate a non-stationairy poisson process. I have generated a table with values for 21 hours and the last three hours should be 0. I thought i could either use a rate table with 24 intervals with the last 3 intervals given a value of 0 arrivals. Or i can set a stopping condition at 21 hours. I have set the start time of my simulation at 07:00 (due to worker schedules). I am experiencing the following problems. The rate table seems not to generate the right values at the right times. (i have tried both setting the 0700 values at 0000 and 0700 in the rate table). The rate table does not stop after generating 21 hours of arrivals. In my eventual experiments i want to use 2 different rate tables (using different sources) that I scale to vary arrivals in a specif way. It is quite important that I understand how I can make this work. Do any of you know how I can fix this?

-
I'm still experiencing the same problem and haven't been able to fix it. I could use a regular arrival table, but then my pattern would not be a non-stationairy poisson process. So I think that I really need to use these rate tables, but somehow the inputs of the rate table don't reflect the outputs.
-
Just want to remind you that the values in the rate table shows the offset from the simulation start time. Not actual day time. So if your simulation start time is 7 am your first row shows 7 am to 8am time frame and so on. Hope this helps Regards
-
Try adding the value zero for the last three lines of the rate table. Set the interval size to 1hr. That should fix your problem.
-
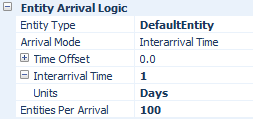
Hi, I have a source with a rate table, it is set to make an output of 100 entities every day. The problem is that the entities comes out one at a time trough that day, but they should all arrive together at the start of the day, so that the servers has the whole day to process them.
-
Hi. I have a process that works in each hour with a diferente statistical distribuition. The operation interval is 24h, so how can I use a rate table with diferent statistical distributions ?
-
Hello, I'm creating a model with different entities, and I want each entity to follow its own rate table. I created the Data Table (called "PatientData") that lists several properties such as mix, service times, priority, and Rate Table. I also created the 8 Rate tables (1 for each type of entity) and entered each one on the Data Table under the Rate Table column accordingly. On my main source, I set the relevant properties as follows: Entity Arrival Logic Entity Type: PatientData.PatientType Arrival Mode: Time Varying Arrival Rate Rate Table: PatientData.RateTable Rate Scale Factor: 1.0 Entities per arrival: 1 When I run the model, I get an Error at 0:00 with the following information: Item: Source'MainEntr' Item Property: Rate Table A runtime error was detected at time 0.0 hours. Error evaluating the value of property 'Rate Table'. Invalid data table reference PatientData. There might be a really easy fix, but I can't seem to find what I'm doing wrong. I was following the same way I'm used to calling columns from table. Thanks for the help!
-
Hello, i want to model time varying arrival rates for my entities. If I choose rate tables I can't select random arrival rates. Is there any possibility to do so? Regards Nadine
-

Source working as per the work schedule for server and worker
cwhitehead replied to Alen's topic in SI General Discussions
Hi Alen, I have attached a model with two different approaches to this question. 1. RateTableApproach - the arrival data is stored within a Rate Table. Note: The Rate (events per hour) is influenced by offsets from when the model begins its run, not by the hour of the day. For example, a model begins its run at clock time 7:00:00, the first entry with a Starting Offset of Day 1, 00:00:00 and Ending Offset of Day 1, 01:00:00 would actually correspond to clock time 7:00:00-8:00:00 and not 00:00:00-01:00:00. 2. ProcessLogicApproach - the Arrival Mode is 'Interarrival Time' which is turned on and off via an Add-On Process. Note: You will need to set the Delay step up to correctly account for the clock time you wish to delay before turning on/off arrivals. All the best, Caleb SourceWorkingAsPerTheWorkScheduleForServerAndWorker.spfx -
Sry i said it should be 100 each day, that was just a mean which i dont want to use. I would like the rate table to make 100 day one, 98 day two and 102 day tree, and a mean cant be used, cause i need to model the reality in the process. And as mentioned before, should the source make all the entities from the table at ones (when the workday starts).
-
Is there a reason you're using a Rate Table instead of the good ol' Interarrival Time?
-
I want to be able to schedule events for the future without having to define a separate timer for each possible time this will happen. Ideally i'd like to be able to index into a vector of timers to start one, so it can be dependent on a state variable. One use of these would be recurring tasks, for instance, while a patient is in post-surgery, they will be administered medicine every r hours. This is dependent on them exiting surgery (it doesn't begin at a specific time), so a rate table doesn't really work, and that would run into a similar problem of having to define different rate tables for each patient type and recurring tasks (potentially hundreds). Any ideas?
-
Hello, everyone! is it possible to use a Look Up Table and Rate Table to the same time in the source in SIMIO? Let me know if you know a way to do that, please. Thanks for your help!
-
Thanks, Jason for your answer and your interest. The situation is the following: I have to receive an order with set amount of entities that must be completed in a specific date and hour, but I need to distribute that order in some intervals before the deadline. It means, If I have an order with 15 entities for November 3 at 8 pm, I could receive 10% of the entities at 7 pm, 50% at 7:30 pm and 40% at 8 pm. So, I have the idea to do an arrival table for the schedule of the order and a rate table for the percentages that I need. And I want to know that is possible in SIMIO to put both in the source? Thanks for your help!
-
 Hi everyone, I am working on a project that has more than 2,000 different arrival distributions. The distributions are all exponential, but they all change over time. To illustrate: suppose I am modeling 30 companies around the world, each company with a group of suppliers (or clients), each supplier (or client) with a group of parts (or orders) that will be arriving in my company to be processed. Each one of these parts coming from each supplier to each company (I will call it a combination) has its own distribution that changes over time. [this is an analogy to my problem] If I had only 1 company with a few suppliers and a few parts, the natural solution would be to use Rate Tables. This would be good because I want to investigate the impact of different Rate Scale Factors (increase or decrease of arrivals) on my key performance indicators. However, as I mentioned, I have more than 2,000 different distributions. So, my main question is: does anyone have a suggestion about how to create these arrivals in an efficient manner? I am assuming creating one source and one table for each possible combination would not be efficient, as it may make the model super heavy. I have thought about two different solutions (which I am not sure if it is good and, even worse, I do not know how to implement yet). So, recommendations to any materials, SimBits or tutorials that might provide more information about my ideas are really appreciated. #1) One idea was using an object inside an object in Simio. This may reduce at least a few combinations?! However, I do not know how to model objects inside objects in Simio. #2) Letting Simio auto-create all my servers and auto-fill the information using tables. This means that I would create one source for each combination. Although this may not be computationally efficient, at least I would not have to drag and drop each one of them. But again, I am new to this auto-create object tool and I do not know how to implement it. So, I really appreciate: - any ideas on how to solve my problem in an efficient way - materials that may teach me how to solve my problem using my idea #1 or #2. Another issue is that RateTables (as far as I know) cannot be imported and binded. So, how can I input all my 2,000 columns of arrival rate data in Simio? Otherwise, my solution #2 is really bad. I have also discussed the idea of grouping the arrivals together and using TableRowReferencing and discrete distributions ("mix") to reduce the number of possible combinations. However, the team I am working with does not think this is a good idea, since each distribution change over time in a different way. So, combining them may not be very accurate. Thanks!
 -
 Hello all and thanks for letting me be a part of Simio Insiders I am closing in on having done my first source, server, sink simulation. It is done as a part of a University study and is due next week. Feel free to download my attempt and have a look at it. The process I want to simulate is as follows: 1. Chef recieves an order of 1-6 beef patties 2. The chef puts the patties in a grill, that has capacity of 12 patties, and a base cooking time/process time of 1 minute total (that increases with order size) 2a. If more orders come in, while the grill is preparing an existing order, they have to be put in queue, as the grill should not be interrupted. When the grill/server is free again, it will take all - or up to 12 - from the queue, depending on how many orders are in queue 3. The patties go to the sink I am using a Time Varying Arrival Rate table from real life data, on the course of 2.5 hours. The trouble I am having is as follows, and please, feel free to only answer some of them, if you don't have answers for all: _____________________________ a) Order size We want to have orders vary from 1 to 6 patties, per order, in a way that resembles this distribution: 1 (min order size) patty ; was ordered 2 times 2 patties ; was ordered 18 times 3 patties ; 9 ... 4 ; 7 5 ; 3 6 (max order size) ; 1 I have not been able to imitate this behavior. Right now, I use Entities per Arrival to be Random.Possion(2), as this looks a bit like this distribution above, but the flaw with Poisson is (I believe), is that an order-size of 0 patties is a possibility, which doesn't make sense. I have also been playing around with a lookup table, without a real clue on if that's the right thing to do. What should I do to resemble this? _____________________________ b) Server (grill) behavior The problem right now is, that the grill (server) can keep taking in patties, even if it's already processing. That doesn't make sense, if you think about it, since you can't put patties into a closed grill. I want it to start preparing an order, as soon as it gets it, and just let the queue of patties build up until the grill is free again. Then, take up to 12 patties into the grill. _____________________________ c) Process times For the grill, I want the process times to follow the amount of patties in the grill. The grill takes 60 seconds to prepare a patty, and we assume each patty takes 2 seconds to load. Therefore, we choose to simplify that: 1 patty takes 62 seconds to make 2 patties take 64 seconds 3 ; 66 sec 4 ; 68 sec 5 ; 70 sec 6 ; 72 sec 7 ; 74 sec 8 ; 76 sec 9 ; 78 sec 10 ; 80 sec 11 ; 82 sec 12 (max grill capacity) patties ; 84 sec Which is basically y = 2x + 60 In the simulation I uploaded, each patty, no matter the order size, just takes 60 seconds, which is incorrect. How do I get the grill to behave like this? _____________________________ d) Batching After getting the server behavior to work, I want to work with the utilization of the grill. My idea is, that if the server (grill) is told NOT to start preparing patties right at the moment, it receives the order, e.g. if the quantity is small, but instead waits a certain amount of seconds, to see if more orders should come in, maybe the total wait can become less. There shouldn't grow any large queues with the current arrival rates, but if we double it, it might become relevant, so customers shouldn't wait for too long. Another option would be, that it waits till a certain amount of patties are in queue, such as a minimum of 6. _____________________________ Thanks again, and I sure hope you will take a look at this! You are more than welcome to edit the file, but it is also fine, if you just type in here. Best regards, Johan Grill.spfx
 -
One option would be to have an arrival table, instead of fitting the data to a distribution - the arrival table would include the time that the arrival occurs (based on your table above) and then you would reference the arrival table from the Source using Arrival Mode == 'Arrival Table'. With an arrival table, you could also include an Arrival Time Deviation (Source - under Other Arrival Stream Options) property as a distribution, which would add some randomness to the arrival time. Another option is to use the Arrival Mode == 'Time Varying Arrival Rate' where you would specify a Rate Table (Data tab) that would include varying rates for different times of day. The interval size and number of intervals can be easily changed. The Rate (events per time period) would include the mean of an exponential distribution and would allow the rates to change hourly or every x hours. You may wish to review a few of the Sample SimBit Solutions (Support ribbon) under the Arrival Logic category of SimBits for more options.
-
Dear Judy, First of all thanks for your reply. Secondly, I attached to you another version of the model after I made some modifications. It can be seen in the model, I named a new server as Section 1 and added into it two tasks (Unloading and Leveling, they were servers in previous model) each has its resource (vehicle). I used only one entity for the two tasks. Section 1 will have total Quantity by 2031.25m3 (Which means the total amount of material, since a truck will unload this material and a grader will level it on the surface). The total length of this server (Section 1) is 200 meters as in real life. For the first resource "Aggregate Tipper Truck", its total number is NumAggTr = 20, its rate per hour is named as QSTTRate (has random value), its total number of trips to finish works is TTS = 113 and quantity in each trip is named as QSTT (has also random value). While for the other resource "Grader", its total number is NumGr = 2, its rate per hour is named as QSTGRate (has random value), its total number of trips to finish works is GTS = 32 and quantity in each trip is named as QSTG (has also random value). Since the previous expressions will increase with acceleration, so I inserted Level With Acceleration for each of them to be used as state variable into Finish (Sink). Finally, PPCQSTT and PPCQSTG are the productivity of each task. I have 5 inquiries and they are: 1- Why the resources did not make the appropriate distance travelling? For example, the number of "Aggregate Tipper Truck" is 20 and total number of trips are 113 so each should make about 6 trips (113/20), since the length of Section 1 is 200 meters, then each should make 1200 meters (200*6). 2- In table which named "Sub-Activity Schedule", if I change the value under "Scheduled Finish Date" column the value under Actual Finish Date will change. Why this occurred and why "Status" never be "Ahead" or "On Time"? 3- How can I calculate the values of PPCQSTT and PPCQSTG Daily or Weekly? 4- If I want to identify constraints into each task, how can I do that? 5- How can I apply the concept of Look-Ahead Planning (Daily or Weekly), to remove the added constraints? Thank you again Best regards, Ahmed Elkherbawy Model 1.spfx
-
Sources don't have associated workschedules for creating entities. There is an Arrival Mode property on the Source that allows entities to be created in different ways. Please see the SimBits (Support panel / Sample SimBit Solutions) named Appointment Arrivals or Source with Rate Table. One option would be to have a Resource with a workschedule that 'controls' the number of entities created in the Source, or the Entities Per Arrival property. To do this, you would create a state variable, let's say HowManyEntities. Within your source, set the Entities Per Arrival to 'HowManyEntities'. Set up the Resource with the workschedule for when you'd like entities to be generated and when not (i.e., so that when capacity is 1, you will change HowManyEntities = 1 and when capacity is 0, you will assign HowManyEntities = 0. Within the Processes window, you can have a process, Process1, that is triggered by 'Resource1.CapacityChanged'. Within that process, have a Decide step that checks the capacity and assigns the correct value for HowManyEntities. The Source then will generate entities using the Interarrival Time specified but based on the workschedule changes of Resource1.
-
Hi I have a situation where we receive applications only during week days. I have a source with a Rate Table but this only allows me to add the rate per day. The end result is that I am receiving the same number of applications over weekends as what I am receiving during the week. This results in servers being overloaded and queues building up. I would like to have the entities arrive during the 5 days of the week and not over Saturdays and Sundays. I would appreciate your help, although I suppose the answer is very simple. I have not used Simio for a few years and I am trying to get back into it. CG
-
you can not use different distributions by using rate tables. Rate table only allows to model nonhomogenous poission processes. You can model different rates within a time period (i.e., events per hour). I do not know what do you want but it seems you should define different functions to represent different type of distributions you want to use and then somehow you should trigger those functions at appropriate times.
-
Hi everyone, I've tried and checked the manual, it seems we cannot get access to the values in rate tables? Basically what I want to do is to do some planning ahead of time by reading and summing the rate data in it. Is the only solution to keep a same regular data table synchronized with the rate tables? The reason of using Rate Table is because it has a build-in function of calculating delay times regarding different rate zones, which is more realistic.
-
Hello Everyone, I would like to use patient daily arrivals to the ED. I have daily totals, but I want them to follow a pattern (eg. at midnight the arrival is much less than during noon). I am trying to include future forecasts (my forecasts are daily forecasts and not hourly) and this is why I need to somehow input daily numbers into rate table but also make it follow the pattern. Would really appreciate help with this! Thank You! Best regards, Sumanth
-
Without the model its hard to guess the problem. But this sounds like an ideal application of a time-indexed table. You could reference the table value directly in the Rate Scale Factor.