RPS Simulation of US Air Force F-16 Fleet Phase Maintenance Cycle

by Captain Christopher Jermaine Bevelle (USAF)

As presented at the 2016 Winter Simulation Conference

Abstract

In fleet management, aircraft undergo phase inspection to maximize aircraft availability. An aircraft is grounded after reaching a maximum threshold of flight hours accrued since its last phase inspection. To manage this process, planners use a time distributed index to track the phase cycle of individual aircraft and keep the planes respectively in-phase. As planes break and maintenance lines become backed-up, the avail-ability of aircraft diminish; the desired effect for the mission is lost, and the constant use of spare planes invite future scheduling hazards. In this example, planners are constantly faced with determining schedules with several random factors and risk. The model presented here via Simio is a risk-based planning and scheduling simulation to identify risk and account for randomness in phase cycles. The result of this model provides the planners the opportunity to input an actual schedule into the system, assess fleet health, and conduct what-if analysis.

Introduction

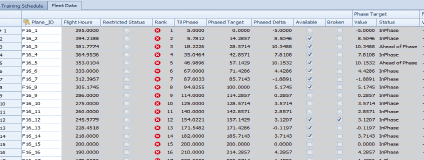
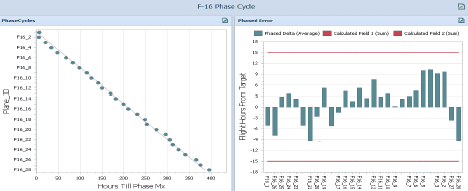
A fleet’s phase maintenance cycle is conceptually determined by dividing the restriction threshold—maxi-mum allowable flight hours accrued since last phase inspection—by the total number of aircraft in the fleet. As an example, a fleet with 20 planes and 400 hours of restriction will have an ideal of 20 hours between phase maintenance per plane as an ideal target. A time indexed distribution is commonly used as a graphical depiction to show each plane’s target time-to-phase. This concept when graphed serves as a countdown technique for a planner to determine what plane to ideally schedule next for phased maintenance and where a plane resides in its projected phase window. The graph will also overlay a scatterplot of actual flight hours accrued per plane. For the purpose of the paper, this value will be known as “phased delta” (the error from the ideal phased target for each plane).

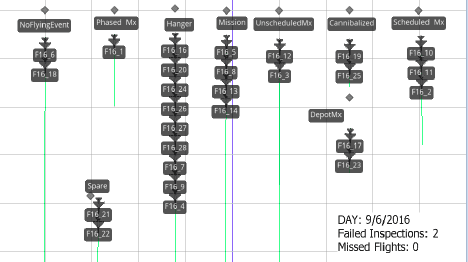
Aircraft are scheduled for training missions (preplanned tempo), phased maintenance (1-3 weeks depending on work conditions), routine/scheduled maintenance (few hours to few days to a few weeks), depot mainte-nance (last several months), and non-flight related activities (day-to-day). Operations/deployments, un-scheduled maintenance due to ‘hard breaks’ are key events that occur randomly and infrequently. Planners may choose to “cannibalize” a plane and strip the plane of its parts to service the needs of other broken planes to avoid longer delays from ordering parts with long lead times (2-4 weeks).

Primarily the training missions account for the vast majority of flight activities. A single flying mission may last 1-3 hours, and planes are commonly scheduled in groups, and groups commonly fly consecutive flights. For example, for one day, a planner will schedule 10 planes to perform one mission, refuel, the same 10 planes complete another mission, then of those planes, 2 will stay at home station, and the remain-ing 8 will continue to perform another mission. Planes will not fly more than 5 consecutive missions. The more a plane flies in short time before going to maintenance, the more likelihood of a ‘hard break’ occur-rence. Of the planes that fly each week (usually 10-14), between 5-10 missions occur each. 2 spares per week may fly between 5-8 missions combined on average. That does not imply that 5-8 breaks occur each week.

Model Description

A simulation was modeled in Simio to develop a visual scheduling tool for flight planners who require the ability to adapt to ever changing requirements. To simulate this case, an “entity” is represented as a “Task-ing Order” or “Request” depending on the case. Each plane is defined with characteristics of a “worker” but special properties have been applied to each plane to track the different assignment/states each plane goes in and out of. At the start of the simulation, fictitious stats for each plane have been assigned and depict a standard phase flow distribution with minor error. Training missions, operations, scheduled/un-scheduled maintenance, phased maintenance, depot maintenance, cannibalized, spares, and non-flying events are represented as “server” stations.

As planes are seized by the different tasking orders/request, the planes are organized fashionably as a basic assignment problem. This approach allows the information to be easily collected and stored in tables, Gantt-charts, control charts, and graphed. Each station possesses detailed selection criteria for which plane will be chosen based on phased delta, flight hours, or some chosen state condition (i.e. restricted, available, etc.). An arrival table by date is created to input real data into the model.

The F-16’s reliability inherently possess a “memoryless” property such that a plane may fly 20 missions in 4 days and be very susceptible to “hard breaks” (e.g. Prob of Failure>10%) but the same plane can fly 20 missions in 10 days and it be normal conditions (Prob of Failure <3%). To model this reliability concept, Markov Chains were applied by assigning a state-variable-vector to each plane that constantly tracks the number of flights each plane has flown each day, only for the last seven days, discarding the old data. A probability of a hardbreak occurring is assessed after each flight using the sum of this reliability vector (RV), and is contingent upon a percentage of a ‘hard break’ occurring under normal conditions (e.g. RV <20) or given that a plane has accrued a threshold number of flights each week (RV>=20).

Analytics

Within the model, a data table is created to 1) establish equivalent work in progress (WIP) and allow the model to begin at steady-state with stats and locations for each plane, 2) initialize and update state variables real-time 3) provide information to feed graphs/reports showing risk and effects on the phase cycle in the given scenario.

A Gantt-chart is embedded in the planning features tab of the model and can be viewed in perspective of each plane or each “Tasking Order”.

The time distribution index (left) is graphed real time within the model. This allows the planner to assess the health of the fleet and easily view the results of a particular what-if scenario. Additionally, fictitious thresholds are shown in the control chart (right) to display the phase error (current hours from phase target.

Analysis

In the original model, planners weekly segregate the available aircraft to fly, not to fly, or to be spares in the event of a hard break. Due to the high number of breaks that may occur, analysis shows that spare planes may be used as frequently as normally scheduled planes in certain situations. Further analysis will provide an optimal quantity of spare aircraft needed under the current conditions to allow the planners to balance flights. By using a weighted and normalized expression to select the best plane, planners will now be able to quantify risk.

The algorithm used in this model allows planners to give priority to aircraft that have less or acceptable risk (i.e. appropriate amount of rest between flights is met). The use of such an algorithm is expected to increase the availability of aircraft by 10-15%. The algorithm used in the model returns a “good” distribution for the fleet according to the standards of Air Force Maintenance Guidance.

Regarding non-flying events, aircraft may be taken out of the pool of available aircraft for days. Because of this, useable aircraft are not ready as spares and appear to diminish the allowable rest time between flights for the planes on average. The selection criteria for aircraft chosen for non-flying events must not be random because this is an opportunity to balance the phase error when the plane is ahead of phase or to rest the plane when it approaches unacceptable risk.

Lastly it appears that the current policy to persistently fly planes that have not been adequately rested will constantly keep the reliability of planes of this current system in jeopardy. In order to allow the planes adequate rest, the rest period must be studied and defined. The maintenance line currently dictates how quickly aircraft become available. A study of the maintenance efficiency and the on-hand inventory (i.e. reduce the need to cannibalize planes for too long) is a possible means for improving the availability of aircraft.

Conclusion

A model of the F-16 Phase Maintenance process was built with data provided from HQ USAFE-AFAFRICA Analysis directorate. Analysis is still in progress to determine the best course of action with what policy will allow. Currently the reliability logic, experimentation with spare planes and resting air-craft. must be studied more before providing a final recommendation. The current model represents normal conditions, but uses fictitious data for the purpose of this academic case study.

Download the case!