
Search the Community
Showing results for 'dashboard'.
Found 5 results
-
 Hello, We are evaluating Simio and really like what we see from exploring the Simio Personal Edition. Custom Dashboards are a high priority for us and we appreciate the fact that Simio seems to allow creation of custom dashboards from within a model; however, we would like to know if Simio allows the creation of custom dashboards that are portable from model to model. For example, we would like to: Create a dashboard that displays a chart depicting activity cost per entity (for a selectable set of entities) over the simulation period. Reuse/import this dashboard into any model to display the activity cost per entity over the simulation period (for a selectable set of entities). Two questions: Is this possible with Simio? If yes, which edition(s) of Simio support this capability? Thanks in advance! Donovan
 -
 A demo model on how to create sub-classed object with moving part, collect stats and show on dashboard. Have fun! ParkingEntryAndExitBoomGates.spfx
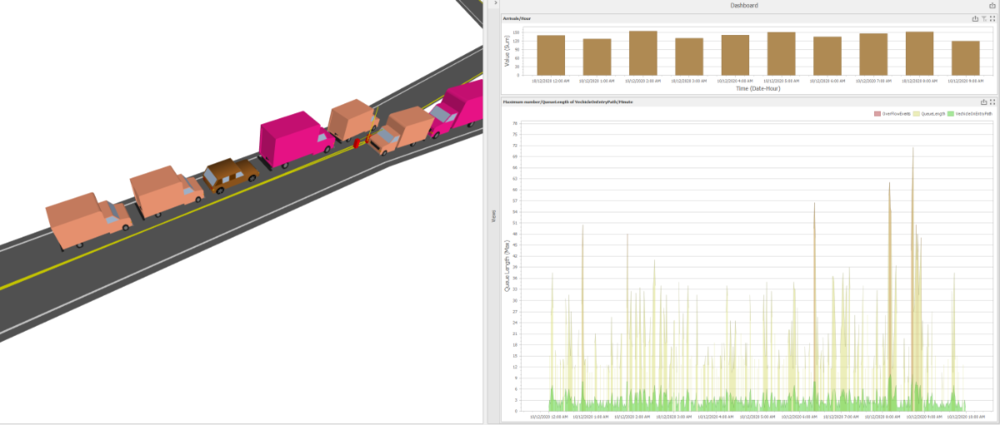
-
 Visualize Utilization in Facility Window or Dashboard Reports I have a source – several servers – sink model. It’s a model of an assembly line production meaning that the entity cannot continue to Server 2 if Server 2 is occupied. The servers have different production times and I want to compare the different utilizations of the servers. I did this over the experiment window and the expression Server1.ResourceState.PercentTime(1) . In a next step I want to visualize these utilizations next each other with something like a bar chart. I came up with two possible ways of doing so but both didn’t work. In the facility window with the animation tools like the linear gauge. The problem here is probably that the expression “PercentTime” has no reference to what the overall time is, while the model is running, and therefore the gauge shows constant 100% the whole time. Or in the experiment window in the dashboard reports which doesn’t have percent time as a response. Is there any other way of visualizing the utilization?
 -
The primary objective of setting warmup time is to reduce or eliminate the effects of any startup bias from the reported statistics (especially when starting "idle & empty"). Perhaps the best way to determine an appropriate warmup time is by plotting the observations of some key statistics and then visually determining at what point the starting bias is minimized. You can accomplish this by: --Creating a real-time plot in the facility view. --Enable logging on some Tallies and then create a Dashboard on that log. --Use a Write step or ExcelWrite step to write each Tally observation to a file and plot it externally. Generally an approximation is "good enough". --If you make it too short, you may include some bias - but the further away you are from time 0 the less the impact of that bias. --If you make it too long, you are just throwing away potentially good results requiring a longer replication to get equivalent results. A warmup that is too long is safer than a warmup that is too short. In general, the longer your replication is compared to the warmup time, the less important the warmup is. For example if you are running for 8 hours and it requires about an hour to reach steady state, then the warmup period is quite important since more than 10% of your data is potentially biased. If you are running for a year, and you reach steady state in a few hours, then the warmup period is much less important and possibly even unnecessary since less than 0.1% of your data is potentially biased. The number of replications you need to run is a totally different issue and has no impact on the warmup time issue. Any good simulation textbook, such as Simio and Simulation: Modeling, Analysis, Applications should explain this in detail.
-
Thanks Glen, I will keep a counter on the dashboard for development purposes. Mark